Figure 1: the interplay of infection and economic activity
A stylised perspective
Source: Columbia Threadneedle Investments, May 2020.
However, we do not expect the Covid-19 pandemic to repeat that pattern witnessed with Spanish Flu a century ago, when the second wave of infections was larger than the first. Instead, we believe that this time each wave will be smaller than the previous one, thanks to the huge advances in healthcare innovation since 1918 and the improved understanding today of how viruses spread. Our scenario also implies that the economic recovery is likely to be U-shaped and somewhat protracted, with setbacks possible as countries move through the second and third peaks.
Although our investment in research resources allows us to revise and update our analysis as the incoming data unfolds, caution is required in making any forecasts since the picture can change very quickly. In addition, there are many legitimate questions over biases and inconsistencies in the quality of data from different countries and between different states within the US, all of which make the data difficult to interpret.
However, imperfect though the data undoubtedly is, it provides the only tool available to help investors to understand the progress of Covid-19 in different parts of the world.
One virus, many different stories
A key area of work for my team has been to try to understand why some countries have seen cases decline from their initial peak more quickly than others. This exercise offers a good illustration of how fresh data changes our understanding of how the pandemic is likely to progress.
The first countries to go through the initial peak, China and South Korea, saw new cases return to minimal levels around 25 days later. However, once the outbreak spread to Europe, we saw bigger initial peaks in Covid-19 infections in some countries, especially Italy and Spain, followed by a more gradual decline from those peaks than we had expected on the basis of the Chinese and Korean experiences.
We now believe the non-linear nature of the virus’s spread is crucial in determining how quickly case numbers decline. Because viruses spread exponentially, rather than in a linear fashion, infections double so rapidly that the speed and stringency of the public health response is critical: a delay of just a few days will result in a much higher peak in the infection curve. Having peaked at a very high level, the subsequent decline will tend to take longer than might otherwise be the case.
The situation that has unfolded in the US – and now seems to be playing out in a number of large emerging markets – is a particularly striking example of this pattern. The US case count has reached a much higher level than elsewhere and the decline from the initial peak has been far slower than early forecasts suggested. Indeed, having levelled off temporarily, case numbers across the southern, sunbelt states are now rising very rapidly, with recent daily totals for new cases in Florida surpassing the numbers recorded in New York at the height of its outbreak.
A muddled picture of the pandemic’s progress has emerged across the US, with states and areas hit early, including New York, New Jersey, Connecticut, Massachusetts, Detroit and King County in Washington bringing their outbreaks under control relatively quickly. This has resulted in local “Covid-19 curves” that closely resemble the picture in badly-affected European countries such as Italy, Spain and France.
However, other parts of the US, notably the southern states, have followed a very different course and now exhibit rapidly accelerating outbreaks, based on daily new cases and the rising proportion of positive test results. Fatalities have also begun to trend upwards again in these states.
We suspect that this pattern is partly the result of initial delays in implementing the public health response, compounded more recently by premature moves to ease lockdown measures that have led to a powerful uptick in case numbers. Underlying reasons for this response include scepticism in the administration about the scientific advice it was receiving, as well as differences in approach across the US’s federal system, with responses varying from state to state. There is also growing anecdotal evidence that more recent infections in the US are concentrated among younger age groups, who may have been more prepared to make a quick return to higher-risk indoor social settings, such as bars and restaurants, as lockdown restrictions were eased.
Throughout the project we have referred to modelling work by independent researchers around the world, including the Institute for Health Metrics Evaluation (IHME), which is affiliated with the University of Washington in Seattle and publishes forecasts for 50 countries as well as individual US states. However, the progress of the pandemic in the US has provided a powerful illustration of the limitations of all modelling exercises. Many models were suggesting two months ago that most parts of the US would return to minimal new-case numbers during the course of July. Instead, the outbreak in the southern states is accelerating.
The failure to forecast this is not necessarily surprising: all models are flawed. But it demonstrates the importance of looking not just at the point-estimates a model produces, but also the potential range of outcomes it suggests as well as the confidence interval around those outcomes.
Our suspicion is that, due to the US’s huge size, the internal spread of the Covid-19 virus has taken longer to play out than was initially assumed and that other factors have also played a significant role, including state and local decisions on when to impose and subsequently ease lockdown restrictions.
What happens next?
The global picture of Covid-19 is becoming more diverse. Developed Asia and Europe appear to have damped down their outbreaks and are progressively reopening their economies. Large emerging markets such as India, Russia, Brazil and South Africa are seeing exponential growth in case numbers. The US presents a muddled picture that sits somewhere between those two poles and our concern is that by failing to bring the virus effectively under control nationally, the US is drawing out its economic downturn and potentially increasing the number of small businesses that will fail as government support is withdrawn over the coming months.
A major part of our recent analysis has revolved around examining how successful different countries have been in re-opening their economies while keeping new case numbers contained. To do this we have combined datasets produced by Apple and Google on individuals’ mobility, based on anonymised GPS information from smart phones, with information on new Covid-19 infections. We have also used data on restaurant bookings from OpenTable.
Our analysis shows that new Covid-19 cases in the US have been climbing rapidly since early to mid-June and that fatalities have started to increase again, while in Europe the numbers remain flat. But at the same time, frequency and time spent at retail and leisure locations in the US, France, Italy and Germany are broadly similar, relative to where they stood before the pandemic began, despite the radically different trajectory of new infections between the US and Europe. Our analysis also shows that use of public transport in France and Germany has returned to pre-pandemic levels, while it remains 60% down in the US.
Figure 2: infections and mobility curves
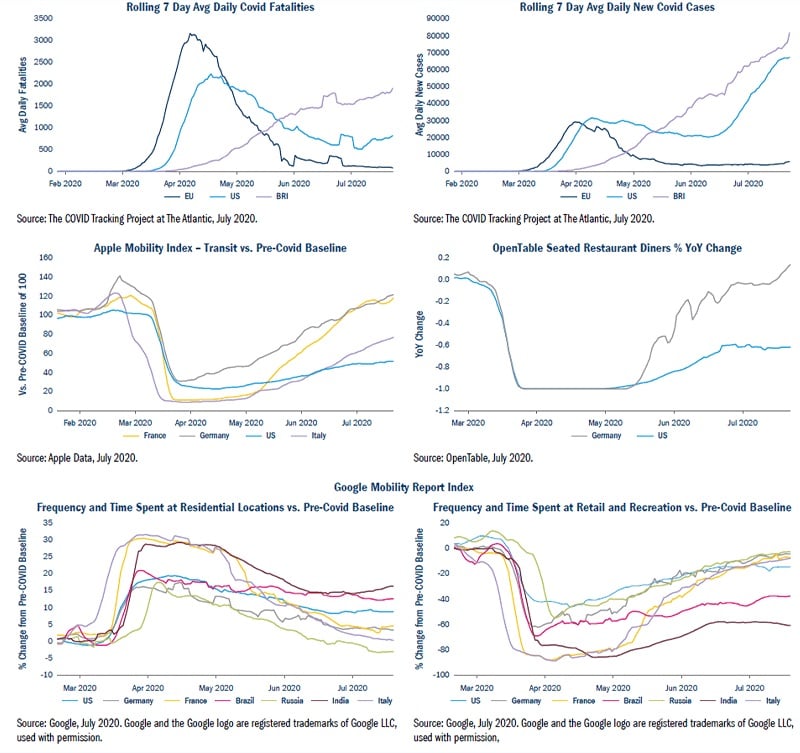
However, as always there are complexities in interpreting the data, especially because the mobility datasets published by Apple and Google are new and experimental. We would expect to see mobility in the northern hemisphere increase during the spring and summer in any case, due to seasonal effects. Since we cannot adjust the Google and Apple data for these effects, it is hard to tell how much of any increase in mobility recently is due to the easing of Covid-19 restrictions and how much would have happened anyway.